Open-Angle Glaucoma Therapeutics Market to Record a CAGR of 7.18%, Development of Biologics to be a Key Trend - Technavio
27 Sep 2022
Small molecular drug
NEW YORK, Sept. 27, 2022 /PRNewswire/ -- One of the key trends in the open-angle glaucoma therapeutics market is the
development of biologics. The market landscape largely contains small molecules, including PGAs and non-PGAs. These molecules are the main option for the treatment of open-angle glaucoma. However, side effects such as lack of patient adherence and the high cost of drugs have resulted in unmet medical needs for effective novel treatments. Several biologics offer better safety and efficacy over small molecules. Thus, the development of new biologics is expected to address the unmet needs for safe and novel treatment of open-angle glaucoma. This, in turn, will boost the growth of the market during the forecast period.
Continue Reading
Preview
Source: PRNewswire
Technavio has announced its latest market research report titled Global Open-Angle Glaucoma Therapeutics Market 2022-2026
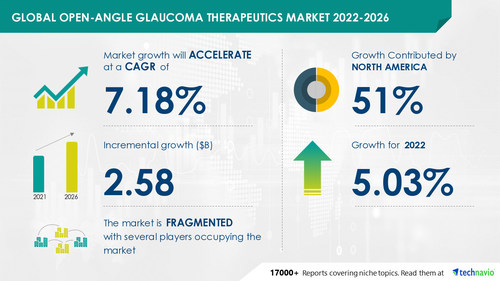
The open-angle glaucoma therapeutics market size is expected to grow by USD 2.58 billion from 2021 to 2026. In addition, the growth momentum of the market will accelerate at a CAGR of 7.18% during the forecast period, according to Technavio. The promising pipeline and recent approvals are driving the open-angle glaucoma therapeutics market growth. However, factors such as advances in glaucoma surgeries may challenge the market growth.
Get a comprehensive report summary that describes the market size and forecast along with research methodology. The FREE sample report is available in PDF format
Open-Angle Glaucoma Therapeutics Market: Product Landscape
By product, the market has been segmented into PGAs and non-PGAs. The
PGAs segment will be the largest contributor to market growth during the forecast period. PGAs are the first-line treatment for open-angle glaucoma. Currently, Bimatoprost, latanoprost, and travoprost are the available PGAs in the market, which are approved for the reduction of intraocular pressure (IOP) in patients with open-angle glaucoma or ocular hypertension. Such factors will boost the market growth during the forecasted period.
Open-Angle Glaucoma Therapeutics Market: Geographic Landscape
By geography, the market has been segmented into North America, Europe, APAC, and Rest of World (ROW).
North America is going to have lucrative growth during the forecast period. About 51% of the market's overall growth is expected to originate from the region. The US and Canada are the key countries in the open-angle glaucoma therapeutics market in North America.
Open-Angle Glaucoma Therapeutics Market: Key Companies and their Offerings
AbbVie Inc., Aerie Pharmaceuticals Inc, Alcon Inc., Bausch Health Co Inc, D.Western, Therapeutics Institute Inc, Hikma Pharmaceuticals Plc, Laboratories Sophia, Merck and Co. Inc., Nicox SA, Novartis AG, Ocuphire Pharma Inc, Otsuka Pharmaceutical Co. Ltd., Pfizer Inc., PharmaMar SA, Santen Pharmaceutical Co. Ltd., Sun Pharmaceutical Industries Ltd, Taro Pharmaceutical Industries Ltd., Teva Pharmaceutical Industries Ltd., Viatris Inc., among others, are the main players in the market. The key offerings of some of these vendors are listed below:
AbbVie Inc. - The company offers open-angle glaucoma therapeutics such as Lumigan and Combigan.
Aerie Pharmaceuticals Inc - The company offers open-angle glaucoma therapeutics, namely Rocklatan and Rhopressa.
Alcon Inc. - The company offers open-angle glaucoma therapeutics, namely Travatan.
Bausch Health Co Inc - The company offers open-angle glaucoma therapeutics, namely Vyzulta.
Hikma Pharmaceuticals Plc - The company offers open-angle glaucoma therapeutics, namely Diazepam.
This report provides a full list of key vendors, their strategies, and the latest developments. Request a FREE PDF Sample Now
Open-Angle Glaucoma Therapeutics Market: What Our Reports Offer
Market share assessments for the regional and country-level segments
Strategic recommendations for the new entrants
Covers market data for 2021, 2022, until 2026
Market trends (drivers, opportunities, threats, challenges, investment opportunities, and recommendations)
Strategic recommendations in key business segments based on the market estimations
Competitive landscaping mapping the key common trends
Company profiling with detailed strategies, financials, and recent developments
Supply chain trends mapping the latest technological advancements
Related Reports
Myopia and Presbyopia Treatment Market by Type and Geography - Forecast and Analysis 2022-2026: The myopia and presbyopia treatment market share is expected to increase by USD 7.22 billion from 2021 to 2026.
Ophthalmology Therapeutics Market by Product and Geography - Forecast and Analysis 2021-2025: The ophthalmology therapeutics market size has the potential to grow by USD 12.34 billion during 2020-2025
Browse Health Care Market Reports
Table of Contents
1 Executive Summary
1.1 Market overview
Exhibit 01: Executive Summary – Chart on Market Overview
Exhibit 02: Executive Summary – Data Table on Market Overview
Exhibit 03: Executive Summary – Chart on Global Market Characteristics
Exhibit 04: Executive Summary – Chart on Market by Geography
Exhibit 05: Executive Summary – Chart on Market Segmentation by Product
Exhibit 06: Executive Summary – Chart on Incremental Growth
Exhibit 07: Executive Summary – Data Table on Incremental Growth
Exhibit 08: Executive Summary – Chart on Vendor Market Positioning
2 Market Landscape
2.1 Market ecosystem
Exhibit 09: Parent market
Exhibit 10: Market Characteristics
3 Market Sizing
3.1 Market definition
Exhibit 11: Offerings of vendors included in the market definition
3.2 Market segment analysis
Exhibit 12: Market segments
3.3 Market size 2021
3.4 Market outlook: Forecast for 2021-2026
Exhibit 13: Chart on Global - Market size and forecast 2021-2026 ($ million)
Exhibit 14: Data Table on Global - Market size and forecast 2021-2026 ($ million)
Exhibit 15: Chart on Global Market: Year-over-year growth 2021-2026 (%)
Exhibit 16: Data Table on Global Market: Year-over-year growth 2021-2026 (%)
4 Five Forces Analysis
4.1 Five forces summary
Exhibit 17: Five forces analysis - Comparison between 2021 and 2026
4.2 Bargaining power of buyers
Exhibit 18: Chart on Bargaining power of buyers – Impact of key factors 2021 and 2026
4.3 Bargaining power of suppliers
Exhibit 19: Bargaining power of suppliers – Impact of key factors in 2021 and 2026
4.4 Threat of new entrants
Exhibit 20: Threat of new entrants – Impact of key factors in 2021 and 2026
4.5 Threat of substitutes
Exhibit 21: Threat of substitutes – Impact of key factors in 2021 and 2026
4.6 Threat of rivalry
Exhibit 22: Threat of rivalry – Impact of key factors in 2021 and 2026
4.7 Market condition
Exhibit 23: Chart on Market condition - Five forces 2021 and 2026
5 Market Segmentation by Product
5.1 Market segments
Exhibit 24: Chart on Product - Market share 2021-2026 (%)
Exhibit 25: Data Table on Product - Market share 2021-2026 (%)
5.2 Comparison by Product
Exhibit 26: Chart on Comparison by Product
Exhibit 27: Data Table on Comparison by Product
5.3 PGAs - Market size and forecast 2021-2026
Exhibit 28: Chart on PGAs - Market size and forecast 2021-2026 ($ million)
Exhibit 29: Data Table on PGAs - Market size and forecast 2021-2026 ($ million)
Exhibit 30: Chart on PGAs - Year-over-year growth 2021-2026 (%)
Exhibit 31: Data Table on PGAs - Year-over-year growth 2021-2026 (%)
5.4 Non-PGAs - Market size and forecast 2021-2026
Exhibit 32: Chart on Non-PGAs - Market size and forecast 2021-2026 ($ million)
Exhibit 33: Data Table on Non-PGAs - Market size and forecast 2021-2026 ($ million)
Exhibit 34: Chart on Non-PGAs - Year-over-year growth 2021-2026 (%)
Exhibit 35: Data Table on Non-PGAs - Year-over-year growth 2021-2026 (%)
5.5 Market opportunity by Product
Exhibit 36: Market opportunity by Product ($ million)
6 Customer Landscape
6.1 Customer landscape overview
Exhibit 37: Analysis of price sensitivity, lifecycle, customer purchase basket, adoption rates, and purchase criteria
7 Geographic Landscape
7.1 Geographic segmentation
Exhibit 38: Chart on Market share by geography 2021-2026 (%)
Exhibit 39: Data Table on Market share by geography 2021-2026 (%)
7.2 Geographic comparison
Exhibit 40: Chart on Geographic comparison
Exhibit 41: Data Table on Geographic comparison
7.3 North America - Market size and forecast 2021-2026
Exhibit 42: Chart on North America - Market size and forecast 2021-2026 ($ million)
Exhibit 43: Data Table on North America - Market size and forecast 2021-2026 ($ million)
Exhibit 44: Chart on North America - Year-over-year growth 2021-2026 (%)
Exhibit 45: Data Table on North America - Year-over-year growth 2021-2026 (%)
7.4 Europe - Market size and forecast 2021-2026
Exhibit 46: Chart on Europe - Market size and forecast 2021-2026 ($ million)
Exhibit 47: Data Table on Europe - Market size and forecast 2021-2026 ($ million)
Exhibit 48: Chart on Europe - Year-over-year growth 2021-2026 (%)
Exhibit 49: Data Table on Europe - Year-over-year growth 2021-2026 (%)
7.5 APAC - Market size and forecast 2021-2026
Exhibit 50: Chart on APAC - Market size and forecast 2021-2026 ($ million)
Exhibit 51: Data Table on APAC - Market size and forecast 2021-2026 ($ million)
Exhibit 52: Chart on APAC - Year-over-year growth 2021-2026 (%)
Exhibit 53: Data Table on APAC - Year-over-year growth 2021-2026 (%)
7.6 Rest of World (ROW) - Market size and forecast 2021-2026
Exhibit 54: Chart on Rest of World (ROW) - Market size and forecast 2021-2026 ($ million)
Exhibit 55: Data Table on Rest of World (ROW) - Market size and forecast 2021-2026 ($ million)
Exhibit 56: Chart on Rest of World (ROW) - Year-over-year growth 2021-2026 (%)
Exhibit 57: Data Table on Rest of World (ROW) - Year-over-year growth 2021-2026 (%)
7.7 US - Market size and forecast 2021-2026
Exhibit 58: Chart on US - Market size and forecast 2021-2026 ($ million)
Exhibit 59: Data Table on US - Market size and forecast 2021-2026 ($ million)
Exhibit 60: Chart on US - Year-over-year growth 2021-2026 (%)
Exhibit 61: Data Table on US - Year-over-year growth 2021-2026 (%)
7.8 Canada - Market size and forecast 2021-2026
Exhibit 62: Chart on Canada - Market size and forecast 2021-2026 ($ million)
Exhibit 63: Data Table on Canada - Market size and forecast 2021-2026 ($ million)
Exhibit 64: Chart on Canada - Year-over-year growth 2021-2026 (%)
Exhibit 65: Data Table on Canada - Year-over-year growth 2021-2026 (%)
7.9 Japan - Market size and forecast 2021-2026
Exhibit 66: Chart on Japan - Market size and forecast 2021-2026 ($ million)
Exhibit 67: Data Table on Japan - Market size and forecast 2021-2026 ($ million)
Exhibit 68: Chart on Japan - Year-over-year growth 2021-2026 (%)
Exhibit 69: Data Table on Japan - Year-over-year growth 2021-2026 (%)
7.10 UK - Market size and forecast 2021-2026
Exhibit 70: Chart on UK - Market size and forecast 2021-2026 ($ million)
Exhibit 71: Data Table on UK - Market size and forecast 2021-2026 ($ million)
Exhibit 72: Chart on UK - Year-over-year growth 2021-2026 (%)
Exhibit 73: Data Table on UK - Year-over-year growth 2021-2026 (%)
7.11 Germany - Market size and forecast 2021-2026
Exhibit 74: Chart on Germany - Market size and forecast 2021-2026 ($ million)
Exhibit 75: Data Table on Germany - Market size and forecast 2021-2026 ($ million)
Exhibit 76: Chart on Germany - Year-over-year growth 2021-2026 (%)
Exhibit 77: Data Table on Germany - Year-over-year growth 2021-2026 (%)
7.12 Mexico - Market size and forecast 2021-2026
Exhibit 78: Chart on Mexico - Market size and forecast 2021-2026 ($ million)
Exhibit 79: Data Table on Mexico - Market size and forecast 2021-2026 ($ million)
Exhibit 80: Chart on Mexico - Year-over-year growth 2021-2026 (%)
Exhibit 81: Data Table on Mexico - Year-over-year growth 2021-2026 (%)
7.13 Market opportunity by geography
Exhibit 82: Market opportunity by geography ($ million)
8 Drivers, Challenges, and Trends
8.1 Market drivers
8.2 Market challenges
8.3 Impact of drivers and challenges
Exhibit 83: Impact of drivers and challenges in 2021 and 2026
8.4 Market trends
9 Vendor Landscape
9.1 Overview
9.2 Vendor landscape
Exhibit 84: Overview on Criticality of inputs and Factors of differentiation
9.3 Landscape disruption
Exhibit 85: Overview on factors of disruption
9.4 Industry risks
Exhibit 86: Impact of key risks on business
10 Vendor Analysis
10.1 Vendors covered
Exhibit 87: Vendors covered
10.2 Market positioning of vendors
Exhibit 88: Matrix on vendor position and classification
10.3 AbbVie Inc.
Exhibit 89: AbbVie Inc. - Overview
Exhibit 90: AbbVie Inc. - Product / Service
Exhibit 91: AbbVie Inc. - Key offerings
Exhibit 92: Aerie Pharmaceuticals Inc - Overview
Exhibit 93: Aerie Pharmaceuticals Inc - Product / Service
Exhibit 94: Aerie Pharmaceuticals Inc - Key offerings
10.5 Alcon Inc.
Exhibit 95: Alcon Inc. - Overview
Exhibit 96: Alcon Inc. - Business segments
Exhibit 97: Alcon Inc. - Key offerings
Exhibit 98: Alcon Inc. - Segment focus
10.6 Bausch Health Co Inc
Exhibit 99: Bausch Health Co Inc - Overview
Exhibit 100: Bausch Health Co Inc - Business segments
Exhibit 101: Bausch Health Co Inc - Key news
Exhibit 102: Bausch Health Co Inc - Key offerings
Exhibit 103: Bausch Health Co Inc - Segment focus
Exhibit 104: Hikma Pharmaceuticals Plc - Overview
Exhibit 105: Hikma Pharmaceuticals Plc - Business segments
Exhibit 106: Hikma Pharmaceuticals Plc - Key offerings
Exhibit 107: Hikma Pharmaceuticals Plc - Segment focus
10.8 Nicox SA
Exhibit 108: Nicox SA - Overview
Exhibit 109: Nicox SA - Product / Service
Exhibit 110: Nicox SA - Key offerings
10.9 Novartis AG
Exhibit 111: Novartis AG - Overview
Exhibit 112: Novartis AG - Business segments
Exhibit 113: Novartis AG - Key offerings
Exhibit 114: Novartis AG - Segment focus
Exhibit 115: Otsuka Pharmaceutical Co. Ltd. - Overview
Exhibit 116: Otsuka Pharmaceutical Co. Ltd. - Product / Service
Exhibit 117: Otsuka Pharmaceutical Co. Ltd. - Key offerings
10.11 Pfizer Inc.
Exhibit 118: Pfizer Inc. - Overview
Exhibit 119: Pfizer Inc. - Product / Service
Exhibit 120: Pfizer Inc. - Key news
Exhibit 121: Pfizer Inc. - Key offerings
10.12 Viatris Inc.
Exhibit 122: Viatris Inc. - Overview
Exhibit 123: Viatris Inc. - Business segments
Exhibit 124: Viatris Inc. - Key offerings
Exhibit 125: Viatris Inc. - Segment focus
11.1 Scope of the report
11.2 Inclusions and exclusions checklist
Exhibit 126: Inclusions checklist
Exhibit 127: Exclusions checklist
11.3 Currency conversion rates for US$
Exhibit 128: Currency conversion rates for US$
11.4 Research methodology
Exhibit 129: Research methodology
Exhibit 130: Validation techniques employed for market sizing
Exhibit 131: Information sources
11.5 List of abbreviations
Exhibit 132: List of abbreviations
About Us
Technavio is a leading global technology research and advisory company. Their research and analysis focus on emerging market trends and provide actionable insights to help businesses identify market opportunities and develop effective strategies to optimize their market positions. With over 500 specialized analysts, Technavio's report library consists of more than 17,000 reports and counting, covering 800 technologies, spanning across 50 countries. Their client base consists of enterprises of all sizes, including more than 100 Fortune 500 companies. This growing client base relies on Technavio's comprehensive coverage, extensive research, and actionable market insights to identify opportunities in existing and potential markets and assess their competitive positions within changing market scenarios.
Contact
Technavio Research
Jesse Maida
US: +1 844 364 1100
UK: +44 203 893 3200
Email: [email protected]
Website: www.technavio.com/
SOURCE Technavio
For more details,please visit the original website
The content of the article does not represent any opinions of Synapse and its affiliated companies. If there is any copyright infringement or error, please contact us, and we will deal with it within 24 hours.
Organizations
Indications
Targets
-Drugs
Hot reports


Get started for free today!
Accelerate Strategic R&D decision making with Synapse, PatSnap’s AI-powered Connected Innovation Intelligence Platform Built for Life Sciences Professionals.
Start your data trial now!
Synapse data is also accessible to external entities via APIs or data packages. Leverages most recent intelligence information, enabling fullest potential.